Cover for histogram aggregation and quantiles, with observe, decide and act steps.

Prometheus histograms retain a bucketed distribution

A latency mean can conceal a slow subset of requests. A histogram retains more distribution information by counting observations into buckets, but it still discards detail within each bucket. Prometheus can estimate quantiles from those counts without storing every observation. The estimate depends on bucket boundaries and aggregation; it is not a recovery of the complete original latency distribution. ...
January 6, 2027 · 5 min · XB Field Notes
Latency and errors observed over an interval alongside a clearly labeled worker and queue snapshot.

The golden signals of health

Latency, traffic, errors, and saturation are four complementary ways to ask whether a service is serving users well. They are a starting set of questions, not four universal counters that prove health by themselves. Their usefulness depends on where they are measured, which work they describe, and how their time windows align. A fast response can still be a failed operation. ...

November 29, 2026 · 4 min · XB Field Notes
Three connected blocks labeled Observe, Decide, and Act.

Metrics and logs need an explicit population

Metrics and logs are different representations of observed behavior, not competing definitions of truth. A metric usually summarizes measurements under a set of dimensions. A log record describes an event and can carry detailed context. Both can answer aggregate questions if their coverage and semantics support the calculation. Neither becomes authoritative merely because its dashboard looks cleaner or its records contain more fields. ...

October 16, 2026 · 5 min · XB Field Notes
Observe-decide-act boxes beside the message: State the symptom, link the next check.

Alerts tell you what to read

An alert should give its reader a useful first investigation, not merely a red indicator. Name the observed condition, affected scope, persistence window, responsible team, and next evidence to inspect. These details are part of the rule’s behavior: test them with the trigger instead of treating notification text as decoration added after the incident. ...

September 22, 2026 · 5 min · XB Field Notes
Coarse and finer latency buckets producing different percentile estimates from the same observations.

Histograms preserve the latency shape

A mean can make an uncomfortable service look fast. If ninety-five requests take 50 milliseconds and five take two seconds, the average is only 147.5 milliseconds. A latency histogram retains more information about that slow minority without storing every request. What it preserves is a bucketed approximation of the distribution, not the complete original observations or an automatically exact percentile. ...

September 20, 2026 · 5 min · XB Field Notes
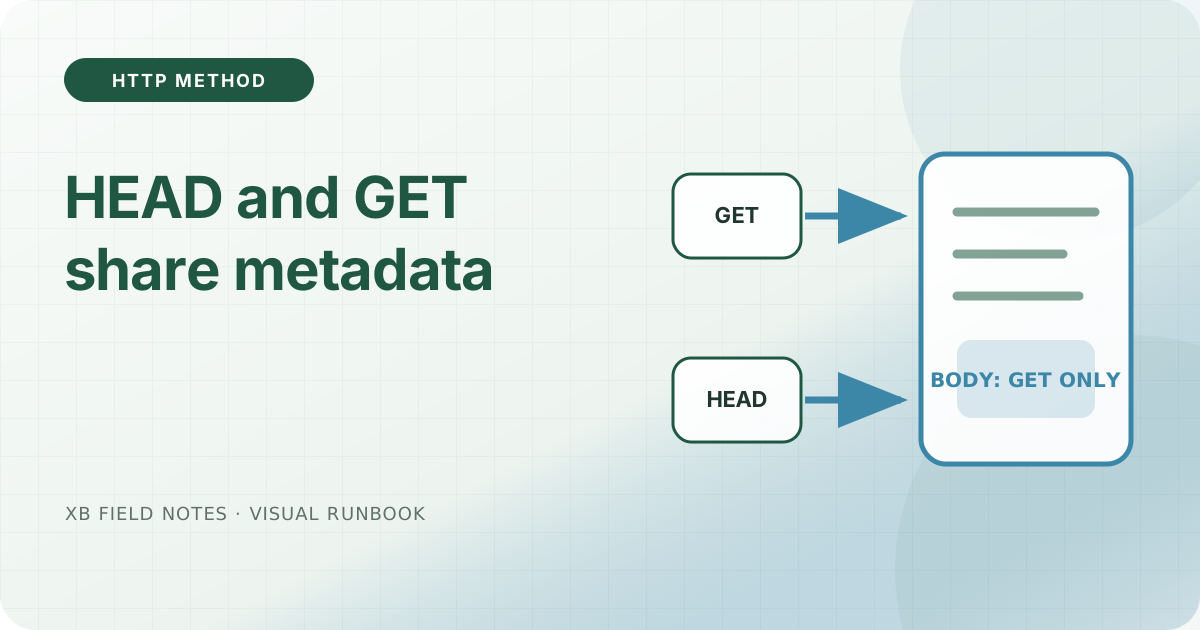
GET and HEAD requests aligned to the same response metadata while only GET carries a body.

HEAD should describe the same representation as GET

HEAD is a metadata view of GET; status and representation headers should tell the same story.

June 22, 2026 · 2 min · XB Field Notes
A certificate shield with a validity and expiry gauge.

Certificate expiry is a date, not a dashboard color

Use SNI, inspect the public certificate, and alert before renewal becomes an incident.

June 10, 2026 · 2 min · XB Field Notes