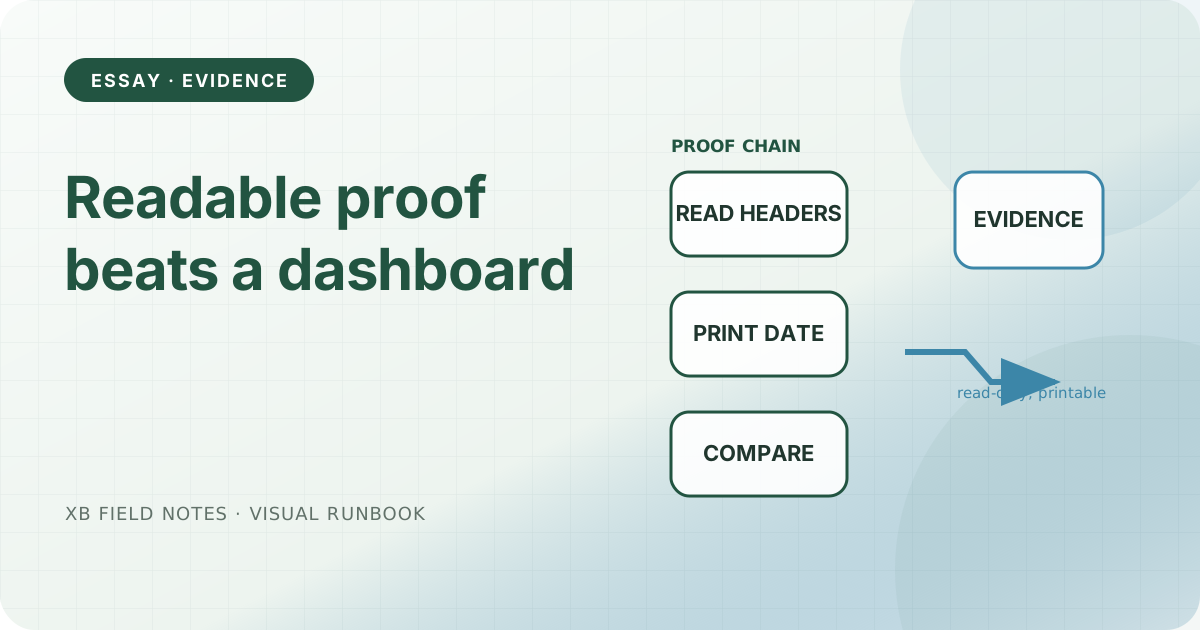
Monitoring dashboards are convenient, but convenience is not the same as evidence. This essay argues that for a small static service, the most auditable form of “is the site healthy?” is a set of plain-text facts an operator can read, re-run, and paste into a report — not an aggregated panel.
The distinction matters because the two answer different questions. A dashboard is a lens over many samples, tuned to alert you to trends. A probe is a single, reproducible observation of the public edge. When the job is to prove a release or diagnose a specific request, the probe is the higher-fidelity artifact.
The dashboard’s aggregation is the risk
A dashboard turns thousands of raw observations into a series of aggregated panels: average latency, error rate, uptime percentage. Aggregation is where the audit trail thins. An “uptime 99.98%” figure does not tell you which request failed, which header was wrong, or whether today’s release is the one being served. It is a summary that erases the evidence that produced it unless you keep the raw log elsewhere.
For a confidence property like “the edge serves the tree I staged”, a dashboard is the wrong tool. That property is answered by a single deterministic observation, and a terminal command can answer it exactly once.
A probe you can read
The site ships a small read-only helper, downloads/check-http-headers.sh, that prints the served response in plain text:
HTTP/2 200
content-type: text/html; charset=utf-8
content-security-policy: default-src 'self'; …; script-src 'none'; …
A human reads this line and knows three things at once: the status is 200, the type is HTML, and the no-script policy is actually being served. Compare that to a panel that says “edge OK” — the panel requires trust in whatever computed it; the header line is itself the evidence. The certificate is judged the same way, by reading notAfter as a date rather than a color in a panel.
Replace signal loss with a checkable statement
The mechanism the site favors instead of a dashboard is a contract enforced during build and a set of deterministic commands for the release window. Roughly:
- Offline checks validate the artifact (every internal link, every SVG, the no-script boundary, the checksums).
- A single read-only probe against the public edge confirms status, headers, and certificate in one invocation.
- A byte manifest ties the served tree to the staged tree so “agrees with what we staged” is a hash, not a feeling.
Each of these is a sentence an operator can paste into an issue or a changelog and a future auditor can re-run. None of them requires a panel to be understood.
When you genuinely need a dashboard
None of this says observability is pointless. If you operate many instances, aggregate capacity, or long trends, a dashboard is the right view to see the forest. The claim is narrower: when the question is “is this one release healthy at the public edge”, the answer lives in a reproducible terminal read, and bolting a panel on top adds latency and aggregation loss without adding evidence.
The decision heuristic is simple. If a statement can be checked with one command and its output is the proof, prefer the command and keep dashboard only where you genuinely need the aggregate. That keeps the site’s own operational story as auditable as the site’s content.
Sources
- Curl documentation, reading response headers from a single invocation, checked 2026-08-18.
- Twelve-Factor: Logs, treating logs as event streams an operator can read, checked 2026-08-18.
- OpenTelemetry: Observability primer, observability as high-cardinality, contextual output, checked 2026-08-18.